
Customer satisfaction metrics are the foundation of every great customer experience strategy and most businesses aren’t using them to their full potential.
You can’t improve what you don’t measure. These metrics give you a direct line into how your customers actually feel about your brand — not how you think they feel, but what they’re genuinely experiencing across every interaction and every channel.
For support leaders, COOs, founders, and CX managers, these metrics aren’t just reporting tools. They’re how you catch problems early, make smarter decisions, and build the kind of experience that keeps customers coming back.
This guide covers what to track, why it matters, and how to turn data into action.
What Are Customer Satisfaction Metrics?
Customer satisfaction metrics are measurable indicators of how well your products, services, and support experiences are meeting customer expectations. They translate something subjective, like how a customer feels, into something you can track, benchmark, and act on.
What Is Customer Satisfaction?
Customer satisfaction is a measure of how well a company’s products, services and overall experience meet or exceed customer expectations. Customer satisfaction metrics turn that feeling into numbers you can track and compare over time.
How Metrics Measure Experience Performance
Customer experience is made up of hundreds of individual interactions. Metrics help you evaluate those interactions at scale, identifying patterns that individual feedback alone would never surface.
They also give different parts of your business a common language. When support, operations, and leadership are all looking at the same data, decisions get made faster and with greater alignment.
Types of Customer Satisfaction Metrics
Customer satisfaction metrics fall into two useful groups.
- Direct metrics come from asking customers, such as CSAT, NPS, CES and survey comments. They show what customers say.
- Indirect metrics come from behavior, such as churn, retention, repeat contacts and repeat purchases. They show what customers do.
Operational metrics such as first response time, first contact resolution and resolution time are a related group. They measure how well your support team performs, while satisfaction metrics measure how customers feel about it. Survey scores and behavior don’t always agree. A customer can rate an interaction highly and still leave later, so a reliable program tracks both.
Customer Satisfaction vs. Customer Success
These two concepts are related but different and confusing them creates measurement gaps.
Customer satisfaction measures how a customer feels about a specific interaction. It’s reactive and tells you how things went.
Customer success measures whether a customer is achieving their goals with your product or service. It’s forward-looking, telling you whether they’re on track to stay and grow. The best CX strategies track both.
Why Customer Satisfaction Metrics Matter for Business Growth
The Link Between Satisfaction and Revenue
Satisfied customers spend more, stay longer, and refer others. Dissatisfied ones leave, usually without saying a word.
The relationship between satisfaction and revenue isn’t theoretical. It shows up in retention rates, repeat purchase behavior, and the cost of replacing customers you’ve lost. When satisfaction improves, so does the bottom line.
How Satisfaction Drives Loyalty and Retention
There’s a real difference between a customer who stays because switching is inconvenient and one who stays because they value the relationship.
Satisfaction metrics help you understand which category your customers fall into and what it would take to deepen that loyalty. Loyal customers are more forgiving when things go wrong, more likely to try new products, and more likely to recommend you to others.
The Cost of Ignoring the Data
Many customers who encounter a poor experience choose not to speak up. They leave quietly. That silent churn is what makes tracking satisfaction so critical. It gives you visibility into problems that would otherwise stay invisible until the damage is done.
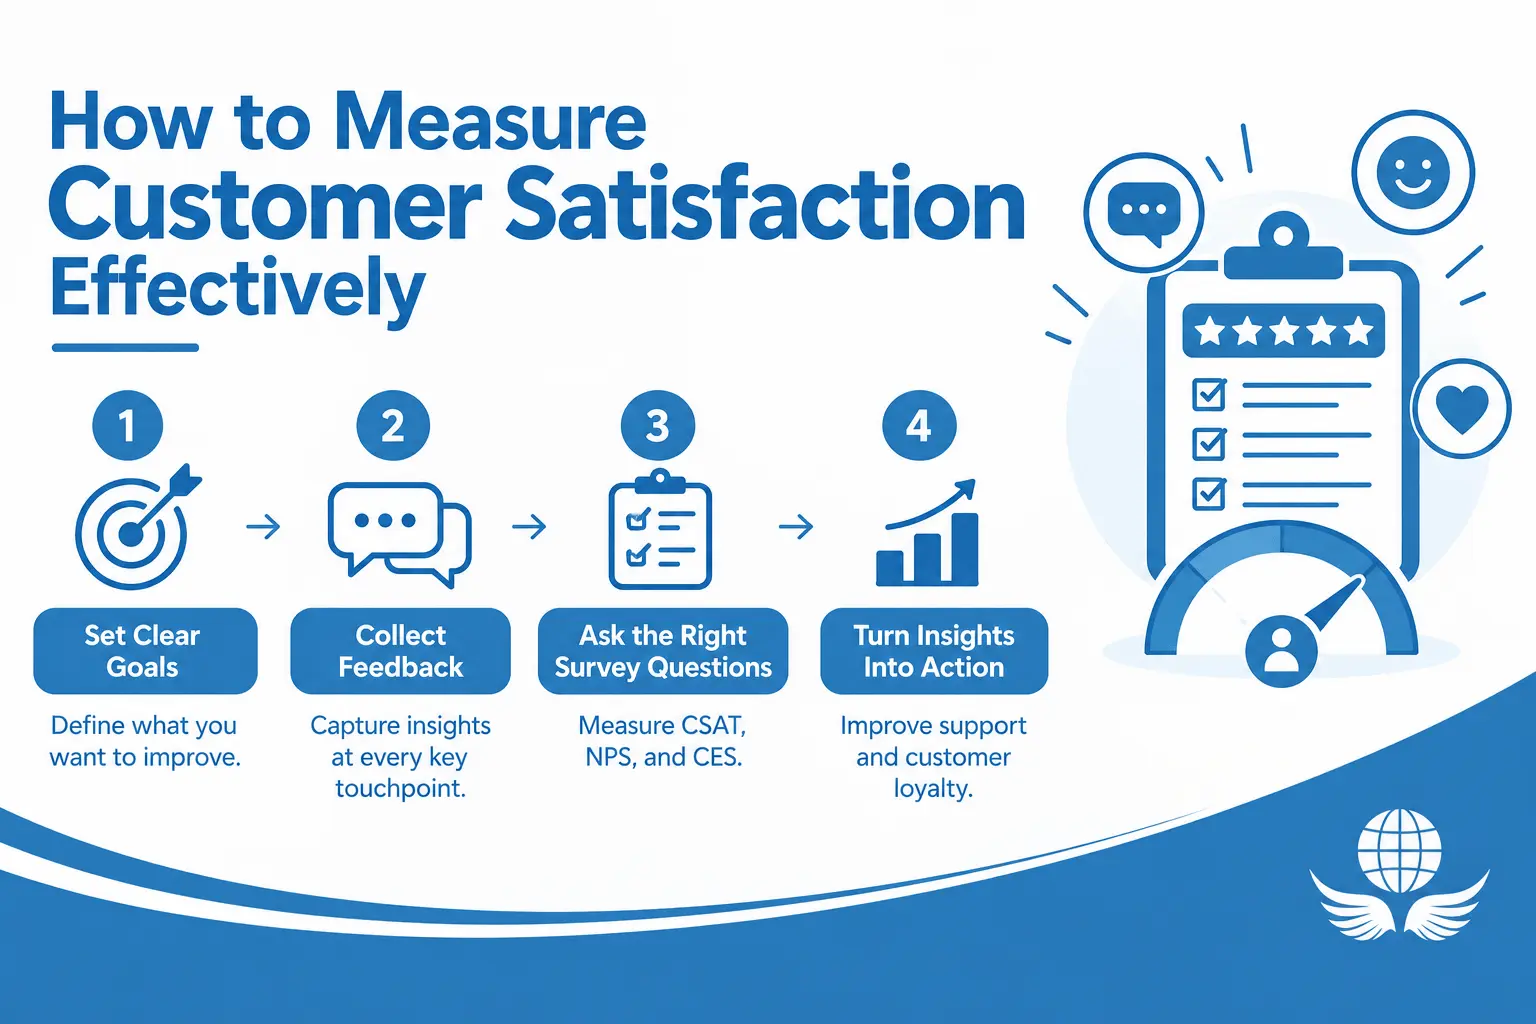
How to Measure Customer Satisfaction Effectively
Set Clear Goals First
Before you measure, know what you’re measuring for. Are you trying to reduce churn? Improve resolution times? Identify drop-off points in the journey? The metrics you prioritize should follow from those goals. Tracking everything creates noise. Tracking the right things creates insight.
Collect Feedback Across the Entire Journey
A single post-chat survey gives you one data point. A feedback strategy that spans the full customer journey gives you a map.
Collect input at the moments that matter — after a purchase, after a support interaction, at onboarding, at renewal. Use different methods depending on the channel: in-app prompts, email surveys, post-call follow-ups, or proactive outreach for high-value accounts.
Sample Customer Satisfaction Survey Questions
| Metric | Sample question | Scale |
|---|---|---|
| CSAT | “How satisfied were you with your support experience today?” | 1–5 |
| NPS | “How likely are you to recommend us to a friend or colleague?” | 0–10 |
| NPS follow-up | “What is the main reason for your score?” | Open text |
| CES | “How easy was it to get your issue resolved?” | 1–7 |
| Repurchase intent | “How likely are you to keep using our service over the next 12 months?” | 1–5 |
Turn Insights Into Action
Data without action is just reporting. The real value comes from what you do with the insights — feeding them into support training, process improvements, product decisions, and communication strategies. Build a clear process for who reviews the data, how often, and who owns the follow-through.
Essential Customer Satisfaction KPIs Every Business Should Track
Customer Satisfaction Metrics at a Glance
| Metric | What it measures | Formula | Typical benchmark* |
|---|---|---|---|
| CSAT | Satisfaction with one interaction | (Satisfied responses ÷ total responses) × 100 | 75–85% |
| NPS | Likelihood to recommend | % promoters − % detractors | 30+ good, 50+ excellent |
| CES | Effort to get something done | Average rating, 1–7 scale | 5+ (higher = easier) |
| FCR | Issues solved on first contact | (Resolved on first contact ÷ eligible contacts) × 100 | ~70% average, 80%+ strong |
| Churn | Customers lost in a period | (Customers lost ÷ customers at start) × 100 | Varies by industry |
*Benchmarks vary by industry and channel. Track your own trend over time.
Customer Satisfaction Score (CSAT)
The most direct measure of satisfaction. After a specific interaction, customers rate their experience, typically on a scale of one to five.
It’s fast to collect and easy to track over time. Its limitation is that it captures a moment, not a relationship. Use it as a real-time pulse check on specific touchpoints, not as a standalone measure of overall customer health.
How to calculate CSAT
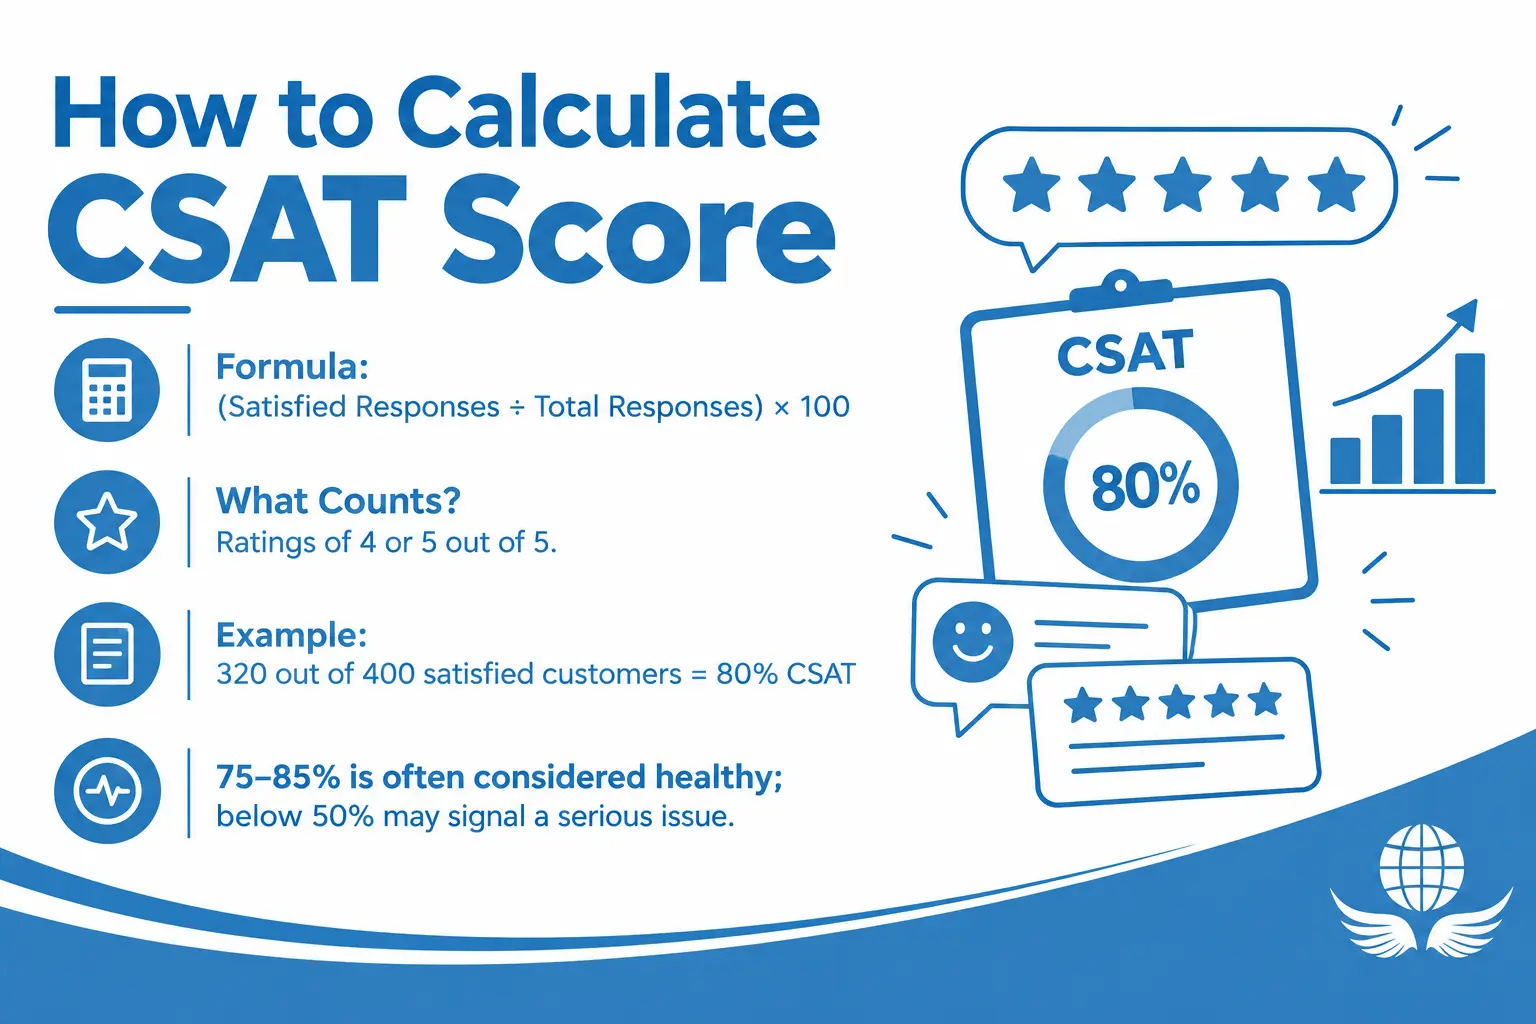
CSAT % = (satisfied responses ÷ total responses) × 100. On a 5-point scale, ratings of 4 and 5 count as satisfied. For example, if 320 of 400 customers give a 4 or 5, CSAT = 80%. Many teams treat 75-85% as healthy, and a score below 50% signals a serious problem.
Net Promoter Score (NPS)
NPS asks one question: how likely are you to recommend us to someone you know?
Responses fall into Promoters, Passives, and Detractors. The score is the gap between the two extremes. NPS is a strong indicator of overall brand sentiment and loyalty potential. It’s most valuable when tracked over time and paired with qualitative follow-up to understand the why behind the score.
How to calculate NPS
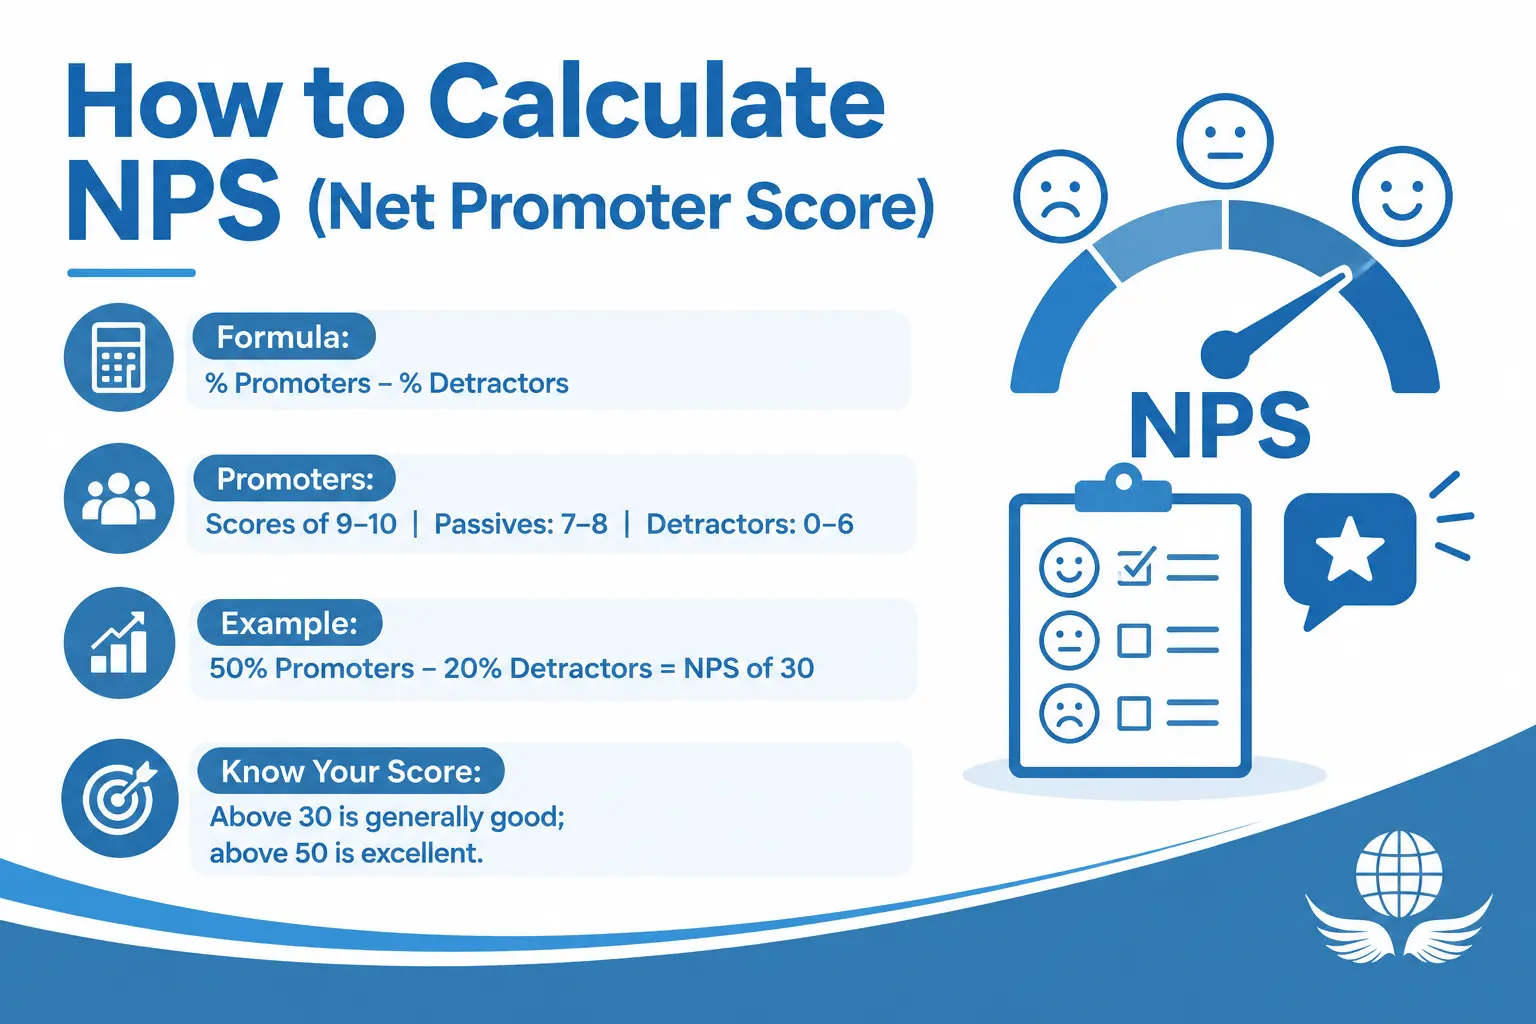
NPS = % promoters (scores 9-10) − % detractors (scores 0-6). Passives (7-8) count in the total but not in the subtraction. For example, if 100 customers respond and 50 are promoters, 30 are passives and 20 are detractors, NPS = 50 − 20 = 30. NPS runs from −100 to +100. A score above 30 is generally seen as good and above 50 as excellent, but the trend and the follow-up comments matter more than any single number.
Customer Effort Score (CES)
CES measures how much effort a customer had to put in to get their issue resolved. It’s one of the strongest predictors of churn because high-effort experiences erode loyalty fast.
The insight is counterintuitive but well-supported: customers don’t need to be wowed. They need to be helped, easily and efficiently. Reducing friction often does more for retention than adding delight.
How to calculate CES
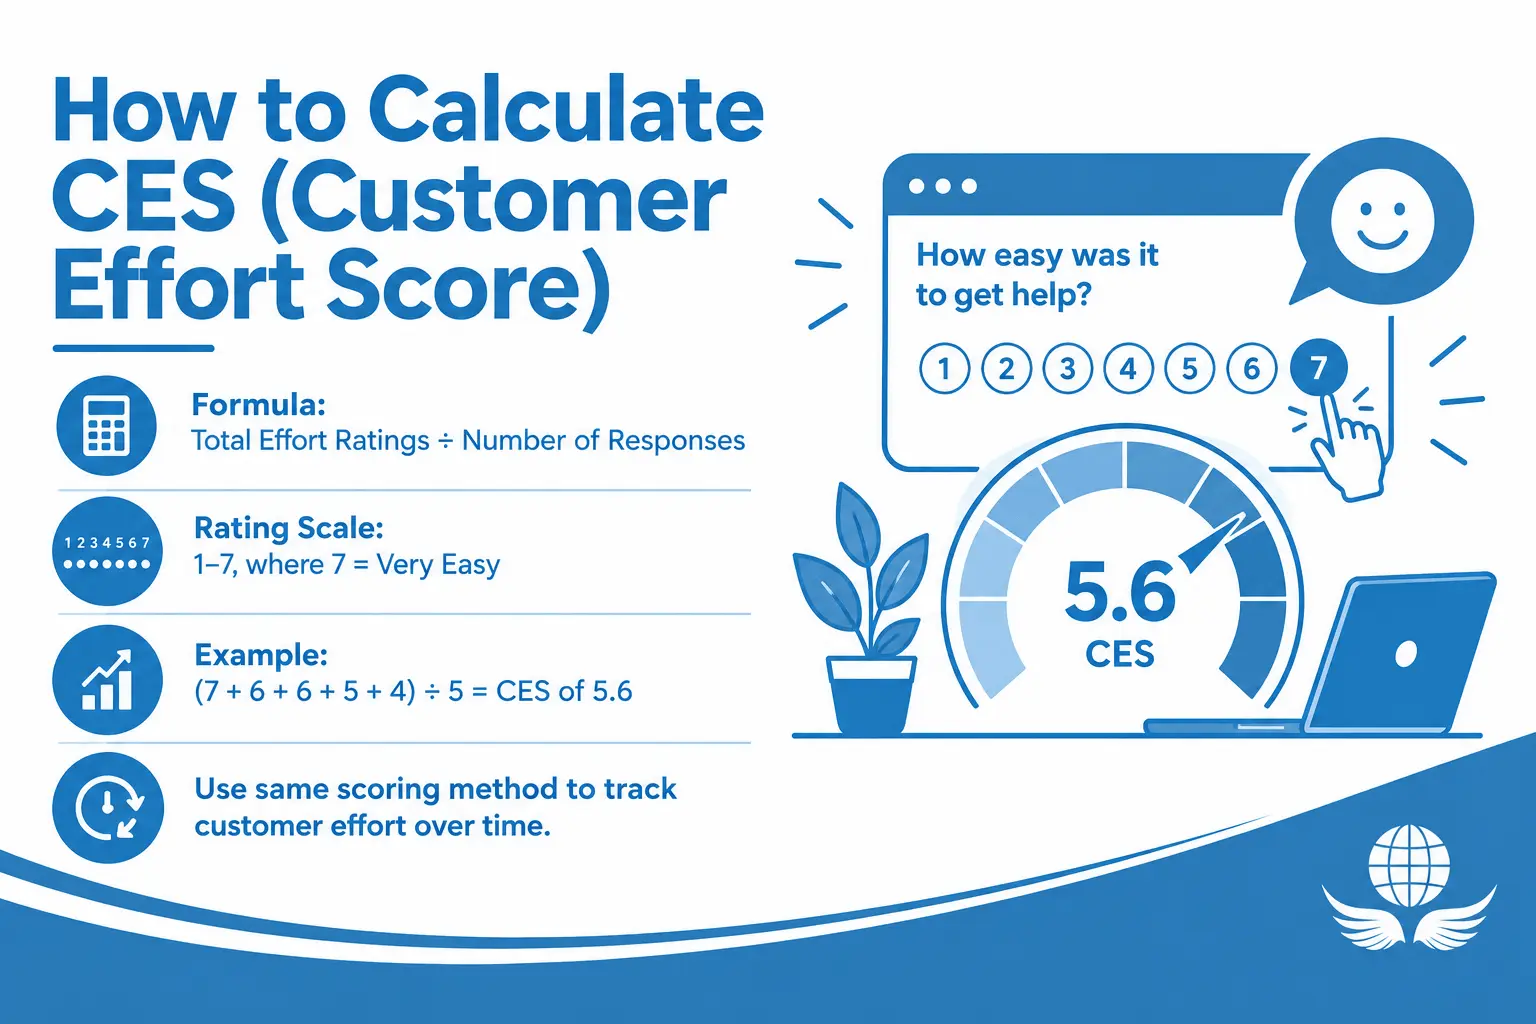
CES = sum of effort ratings ÷ number of responses, on a 1-7 scale where 7 is very easy. For example, if five customers rate 7, 6, 6, 5 and 4, CES = 28 ÷ 5 = 5.6. Some teams invert the scale or report the share of 5-7 ratings instead, so choose one method and use it consistently.
First Response Time and Resolution Time
How quickly you respond and how quickly you resolve — these operational metrics have a direct impact on satisfaction.
Customer expectations around speed have been rising steadily. Long waits and unresolved issues are among the top drivers of negative experiences. Track these by channel and over time to catch bottlenecks before they become complaints.
Average Handle Time (AHT)
Average handle time is the average time an agent spends on one interaction, including talk time, hold time and after-call work.
Formula: AHT = (total talk time + total hold time + total after-call work) ÷ number of calls. For example, if 100 calls take 800 minutes in total, AHT = 8 minutes.
Treat AHT as an efficiency metric, not a goal on its own. Pushing it too low can lead to rushed calls, which can hurt first contact resolution and CSAT.
SLA Adherence Rate
SLA adherence rate shows how often your team meets the response and resolution targets it has committed to.
Formula: SLA adherence % = (tickets that met the SLA ÷ total tickets) × 100. For example, if 920 of 1,000 tickets met the target, adherence = 92%.
Customer Retention and Churn Rate
Retention and churn are the downstream indicators of whether your experience is actually working.
These metrics don’t explain why customers stay or leave on their own — but they validate whether your other satisfaction efforts are moving the needle.
A sustained improvement in CSAT and NPS should eventually show up in better retention. If it doesn’t, something in the experience isn’t translating into loyalty.
How to calculate churn & Retention
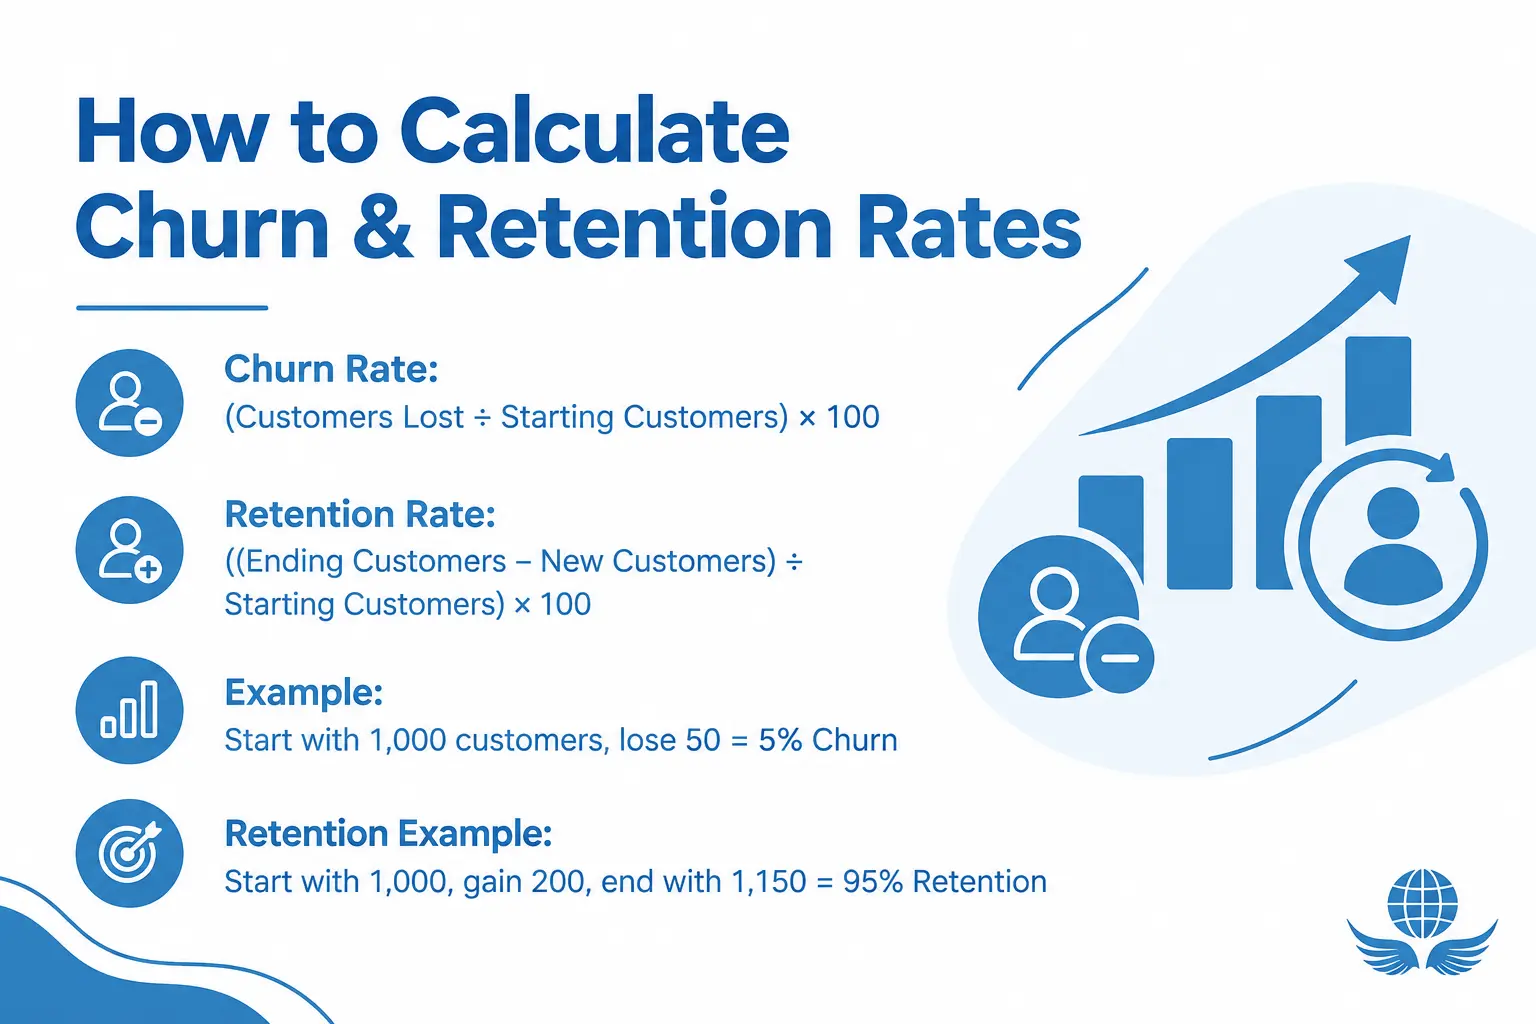
Churn % = (customers lost ÷ customers at the start of the period) × 100. If you start the quarter with 1,000 customers and lose 50, churn is 5%.
Retention % = ((customers at the end of the period − new customers acquired) ÷ customers at the start) × 100. If you start with 1,000 customers, add 200 and end with 1,150, retention is 95%. Always subtract new customers, because strong sales can hide a retention problem.
Churn is a lagging indicator, so by the time it rises, customers have already left. Acceptable churn varies widely by industry and billing model, so compare against peers rather than a universal target.
First Contact Resolution (FCR)
First contact resolution is the share of customer issues solved in the first interaction, with no follow-up needed.
Formula: FCR % = (issues resolved on first contact ÷ total FCR-eligible contacts) × 100. For example, if your team handles 2,000 eligible contacts and resolves 1,400 on the first try, FCR = 70%.
Around 70% is commonly cited as average and 80% or higher as strong, though more complex products usually score lower. A low FCR often points to training gaps, missing information for agents or unclear processes. Count only eligible contacts, since some issues can’t be resolved in one interaction.
Customer Lifetime Value (CLV)
Customer lifetime value estimates the total revenue a customer generates over the whole relationship.
Formula: CLV = average annual revenue per customer × average lifespan in years × gross margin. For example, a customer who pays $1,200 a year, stays 4 years and carries a 70% gross margin has a CLV of 1,200 × 4 × 0.70 = $3,360.
CLV isn’t a satisfaction score, but a rising CLV alongside stable acquisition costs suggests satisfied customers are staying and spending longer.
Net Revenue Retention (NRR)
Net revenue retention shows how much recurring revenue you keep and grow from existing customers, excluding new customers.
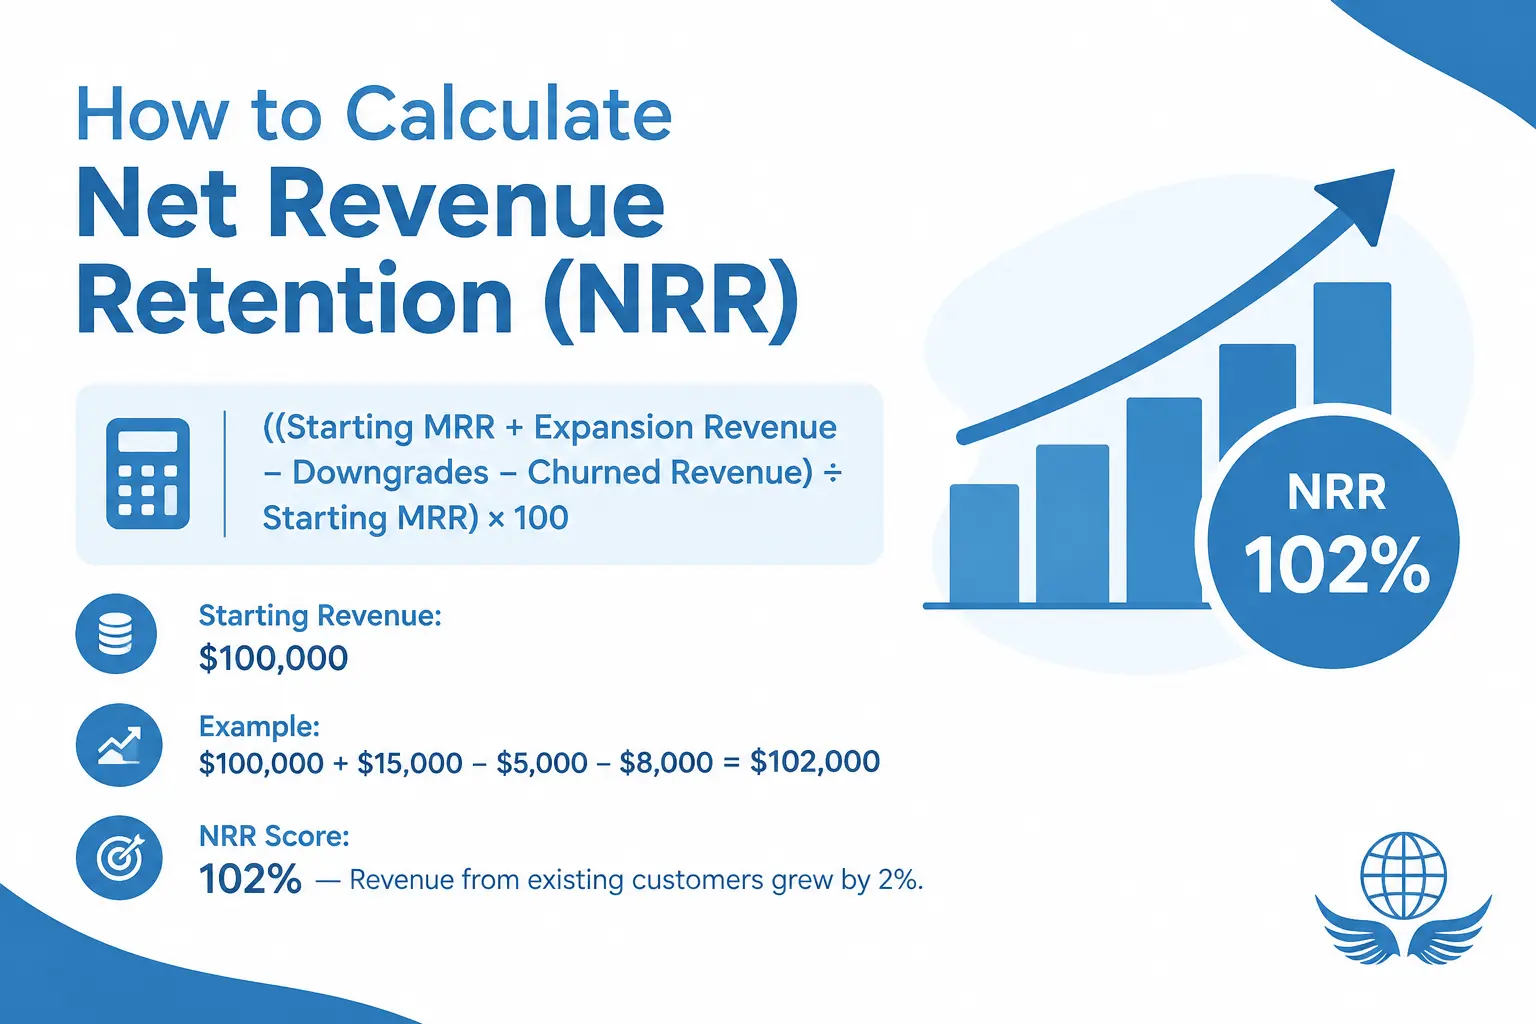
Formula: NRR % = ((starting MRR + expansion − contraction − churned revenue) ÷ starting MRR) × 100. For example, if you start with $100,000 in MRR, gain $15,000 from upgrades, and lose $5,000 to downgrades and $8,000 to cancellations, NRR = (100,000 + 15,000 − 5,000 − 8,000) ÷ 100,000 = 102%.
An NRR above 100% means existing customers are generating more revenue than you lost, even before adding any new ones. It mainly applies to subscription and recurring-revenue businesses.
Customer Experience Metrics That Drive Loyalty
Map Metrics to the Customer Journey
Different metrics matter at different stages.Onboarding metrics show whether customers are realizing value early on. Support metrics reflect day-to-day experience quality. Renewal metrics indicate long-term loyalty.
Mapping your metrics to the journey shifts the conversation from “what’s our average score” to “where specifically are we losing customers and why.”
Find Patterns, Not Just Averages
A single low CSAT score is anecdotal. Fifty low CSAT scores from customers who contacted support about the same issue is a signal worth acting on.
Patterns in the data point to root causes and root causes are what you fix if you want to move the needle at scale.
Segmenting Scores and What Metrics Can’t Tell You
An overall score can hide serious problems. Break scores down by channel, agent, issue type and customer value tier. For example, an overall CSAT of 80% looks healthy, but if billing contacts score 61% while onboarding scores 92%, you know exactly where to act.
Numbers also have limits. CSAT is subjective, NPS measures intent rather than behavior, and a low CES can reflect a complex product rather than weak support. Some customers also leave without complaining. Add an open-text field to your surveys and watch customer behavior alongside the scores.
Connect Metrics to Business Outcomes
The most compelling case for investing in CX is linking satisfaction metrics directly to business results. What’s the revenue difference between a Promoter and a Detractor? What does a one-point CSAT improvement correlate to in terms of retention?
When you can answer those questions with your own data, customer experience stops being a cost center conversation and becomes a growth conversation.
How AI Is Changing Customer Satisfaction Measurement
When AI agents and virtual assistants handle part of your support volume, some traditional metrics become less reliable.
- Survey coverage drops. Many AI-handled conversations are never rated, and the customers who do respond tend to be unusually happy or unusually frustrated.
- Containment is not resolution. Containment rate is the share of conversations AI handles without a human. A “contained” conversation can still leave the customer without an answer, so track it alongside verified resolution.
- Fast isn’t the same as good. Automation improves first response time, but a quick reply that misses the point can still lower satisfaction.
- Separate AI and human conversations, so a strong AI result doesn’t hide a problem in human-handled work, or the reverse.
What to Track Instead
Many teams add outcome-based signals to CSAT: verified resolution rate, helpful rate (a simple yes/no), repeat contact rate, escalation rate and QA scores. You can combine them into a weighted composite score, but treat any weighting as an example to adjust to your own operation, not an industry standard.
Best Practices for Turning Satisfaction Into Loyalty
Stay Present Between Transactions
Loyalty is built between transactions, not just during them. Proactive check-ins, relevant communications, and genuine follow-through signal to customers that the relationship matters beyond the sale.
That doesn’t mean constant contact. It means thoughtful, timely engagement that adds value rather than creating noise.
Build Loyalty and Referral Programs With Real Value
Well-designed programs give customers a tangible reason to stay — and to bring others with them. Keep them simple, make the rewards meaningful, and tie them to behaviors that actually matter: repeat engagement, referrals, long-term commitment.
Programs that are confusing to navigate or slow to reward don’t build loyalty. They create friction.
Close the Feedback Loop Visibly
Customers who give feedback and see it acted on become more invested in the relationship. Ask regularly, listen genuinely, and let customers know what changed as a result of their input.
This doesn’t require a complex system. It requires consistency.
Review the Data on a Regular Cadence
Your metrics are only as valuable as the decisions they inform. Build a regular rhythm of reviewing satisfaction data, identifying what it’s telling you, and adjusting accordingly.
The closer you get to real-time insight, the faster you can respond to shifts in customer sentiment before they become retention problems.
This is where the right support infrastructure matters. Agents Republic was built by industry professionals with decades of customer service outsourcing experience. AR operates with globally distributed agents, multilingual capabilities, and full omnichannel coverage across all time zones.
When your support operation delivers that level of consistency, your satisfaction metrics have room to improve. And when they improve, your business grows. Customer satisfaction metrics are not a reporting exercise. They’re a decision-making system.
Used well, they tell you where your experience is working, where it’s falling short, and exactly where to focus to drive real improvement. The businesses that treat metrics as a foundation are the ones that build lasting loyalty, reduce churn, and create experiences customers genuinely want to return to.
Track the right things. Act on what you find. And make sure your support infrastructure can deliver the consistency your customers expect. Reach out to Agents Republic — we’d love to help.
FAQs About Customer Satisfaction Metrics
What are customer satisfaction metrics?
Measurable indicators used to evaluate how well a business is meeting customer expectations across products, services, and support. Common examples include CSAT, NPS, and CES — each capturing a different dimension of the customer experience.
How can businesses measure customer satisfaction effectively?
By tracking KPIs like CSAT, NPS, and CES across multiple touchpoints throughout the customer journey. The most effective approach combines scores with qualitative feedback, reviews data regularly, and uses insights to drive specific improvements.
Which customer satisfaction KPIs matter the most?
CSAT, NPS, CES, first response time, resolution time, and customer retention and churn rate. Together they give a complete view of experience quality at both the interaction level and the relationship level.
What is the difference between CSAT and NPS?
CSAT measures satisfaction with a specific interaction. It’s transactional and immediate. NPS measures overall brand sentiment and likelihood to recommend — it’s relational and forward-looking. Both answer different questions about the customer experience.
How do satisfaction metrics improve customer loyalty?
By identifying where the experience is breaking down before customers decide to leave. By fixing friction, closing feedback loops, improving consistency you create experiences that give customers a genuine reason to stay.
What is a good CSAT score?
Many teams treat 75-85% as healthy, with anything below 50% a warning sign. Targets vary by industry and channel.
What is a good NPS?
NPS ranges from −100 to +100. Above 30 is generally considered good and above 50 excellent, so compare against peers in your industry.
How do you calculate CSAT, NPS and CES?
CSAT is (satisfied responses ÷ total responses) × 100. NPS is % promoters minus % detractors. CES is the average of effort ratings on a fixed scale, such as 1-7.
What is first contact resolution, and what is a good FCR rate?
FCR is the percentage of eligible issues resolved in the first interaction. Around 70% is commonly seen as average and 80% or higher as strong.
What is average handle time?
AHT is the average time an agent spends on one interaction, including talk time, hold time and after-call work. Read it alongside FCR and CSAT so speed doesn’t come at the expense of quality.
What is the difference between customer satisfaction metrics and customer service metrics?
Satisfaction metrics measure how customers feel, such as CSAT, NPS and CES. Service metrics measure team performance, such as first response time, AHT and SLA adherence. Good programs track both.